AI policy research requires comprehensive data to understand trends, impacts, and public sentiment across jurisdictions and sectors. These curated datasets provide researchers, policymakers, and advocates with essential quantitative foundations for evidence-based analysis and decision-making.
Productivity Stats #
The chart below captures total factor productivity for the private business sector.
The chart below captures labor productivity for Software Publishers NAICS 5112.
The chart below captures output per worker for Software Publishers NAICS 5112.
Annual Capital Expenditures Survey (ACES) for robotic equipment #
Beginning in 2018, the Census added a series of questions to their Annual Capital Expenditures Survey (ACES) to better understand how much companies are spending on robotic equipment. Data from 2022 was published recently for a total of five years of spending data.
The Census defines robot equipment broadly, as “automatically controlled and reprogrammable machines capable of performing a series of complex tasks autonomously or semi-autonomously.” Included in this spending data are robots used in cleaning, construction and demolition, inspection, machine tending, surgical assistance, and welding, among others. But it doesn’t include ATMs, computer numerical control (CNC) machine equipment, or self-service kiosks.
To help researchers understand and better explore this data, we have compiled a Google Sheet with the ACES data in an easy to read table. It is embedded below. The full table is located at the end of this post in Appendix I.
A couple of major highlights from this data:
- Manufacturing ($7,289 million) and retail trade ($3,552 million) spent the most on robotic equipment. Combined, they are 84% of the total expenditures.
- For 2022, U.S. nonfarm employer businesses invested $12,960 million in robotic equipment, a small uptick from the 2021 total of $11,536 million.
- Robotic equipment expenditures accounted for 1.1 percent of total equipment expenditures in 2022 and 2021.
- Car and motor vehicle parts manufacturers are the single biggest ($1,990 million) spenders on robotics, followed by non-store retailers ($1,527 million), food manufacturing ($1,128 million), and semiconductor manufacturers ($1,032).
People are often surprised to discover that the automotive industry leads the pack in spending on robotics. However, the sector has consistently been at the forefront of integrating advanced robotic technologies to enhance precision, efficiency, and safety in production processes.
Business Trends and Outlook Survey (BTOS) AI supplement #
Additionally, the Business Trends and Outlook Survey (BTOS) now includes a number of AI-related questions under the AI supplement, which recently reported their first findings. The AI supplement was constructed to gather insights on the prevalence of AI use in businesses, the various types of AI being employed, the effects of AI on employment, and the ways AI is restructuring business organizations.
The BTOS data is located here. Among other questions, the survey now asks “In the last two weeks, did this business use Artificial Intelligence (AI) in producing goods or services? (Examples of AI: machine learning, natural language processing, virtual agents, voice recognition, etc.)” The average for each sector is arranged in a table below, which includes data collected 12/04/2023 to 02/25/2024.
Not surprisingly, information (18%) ranks at the top of industries for using AI, followed by professional, scientific and technical services (12%), educational services (9%) and management of companies and enterprises (8%).
What’s striking to notice among these two datasets, ACES and BTOS, is that industries buying robotic equipment differ from the industries using AI. Manufacturing and retail trade spent the most on robotic equipment but they tend to use AI the least. To be fair, there is a year difference between the datasets, but the difference remains. Still, these trends underscore that automation is not just one thing.
Employment and Job Postings in the Software Industry #
Beginning in 2022 and gaining momentum through 2023, the tech industry experienced a wave of job cuts that hit software engineers especially hard. The layoff surge peaked in early 2023, then gradually tapered in 2024. The downsizing has continued into 2025.
The scale of these cuts was unprecedented. Amazon’s initial announcement of 10,000 layoffs in 2022 expanded to 18,000 workers by January 2023. This was followed by an additional 9,000 cuts in March. During this period, other tech giants implemented similarly massive reductions: Google eliminated 12,000 positions while Meta reduced its workforce by 11,000 employees. The momentum continued throughout 2023 as major players in the tech industry, including Salesforce, Microsoft, Intel, Tesla, Cisco, and Zoom, announced significant workforce reductions.
To understand the magnitude of the layoffs, Crunchbase and TrueUp began specialized tracking sites. Their estimates are collected below.
Trends observed in this data seemingly fit with the change in Indeed postings for software development jobs.
But when you stack software development job postings alongside all Indeed job postings, as well as research and development job postings, and job postings in banking and finance job postings, a pattern emerge. Postings are slowing for every sector.
If AI were the culprit of the tech layoffs, you’d assume that different industries would be impacted in varying ways. But when taking a step back and looking at the overall trendline, data suggests that everyone is slowing their hiring.
Job employment numbers are classified by industryies via the North American Industry Classification System (NAICS). Software engineers are typically found in NAICS 5415, the broad category for computer systems design, as well as NAICS 5112, which includes software publishers. Combining the two from Bureau of Labor data shows that jobs hit a high-water mark in 2022 of 3,258,000, then declined slightly to 3,244,800 in 2024 for a combined loss of 13,200 jobs.
The Remote Labor Index (RLI) is a benchmark that empirically measures the capability of AI agents to perform real-world, economically valuable remote work.
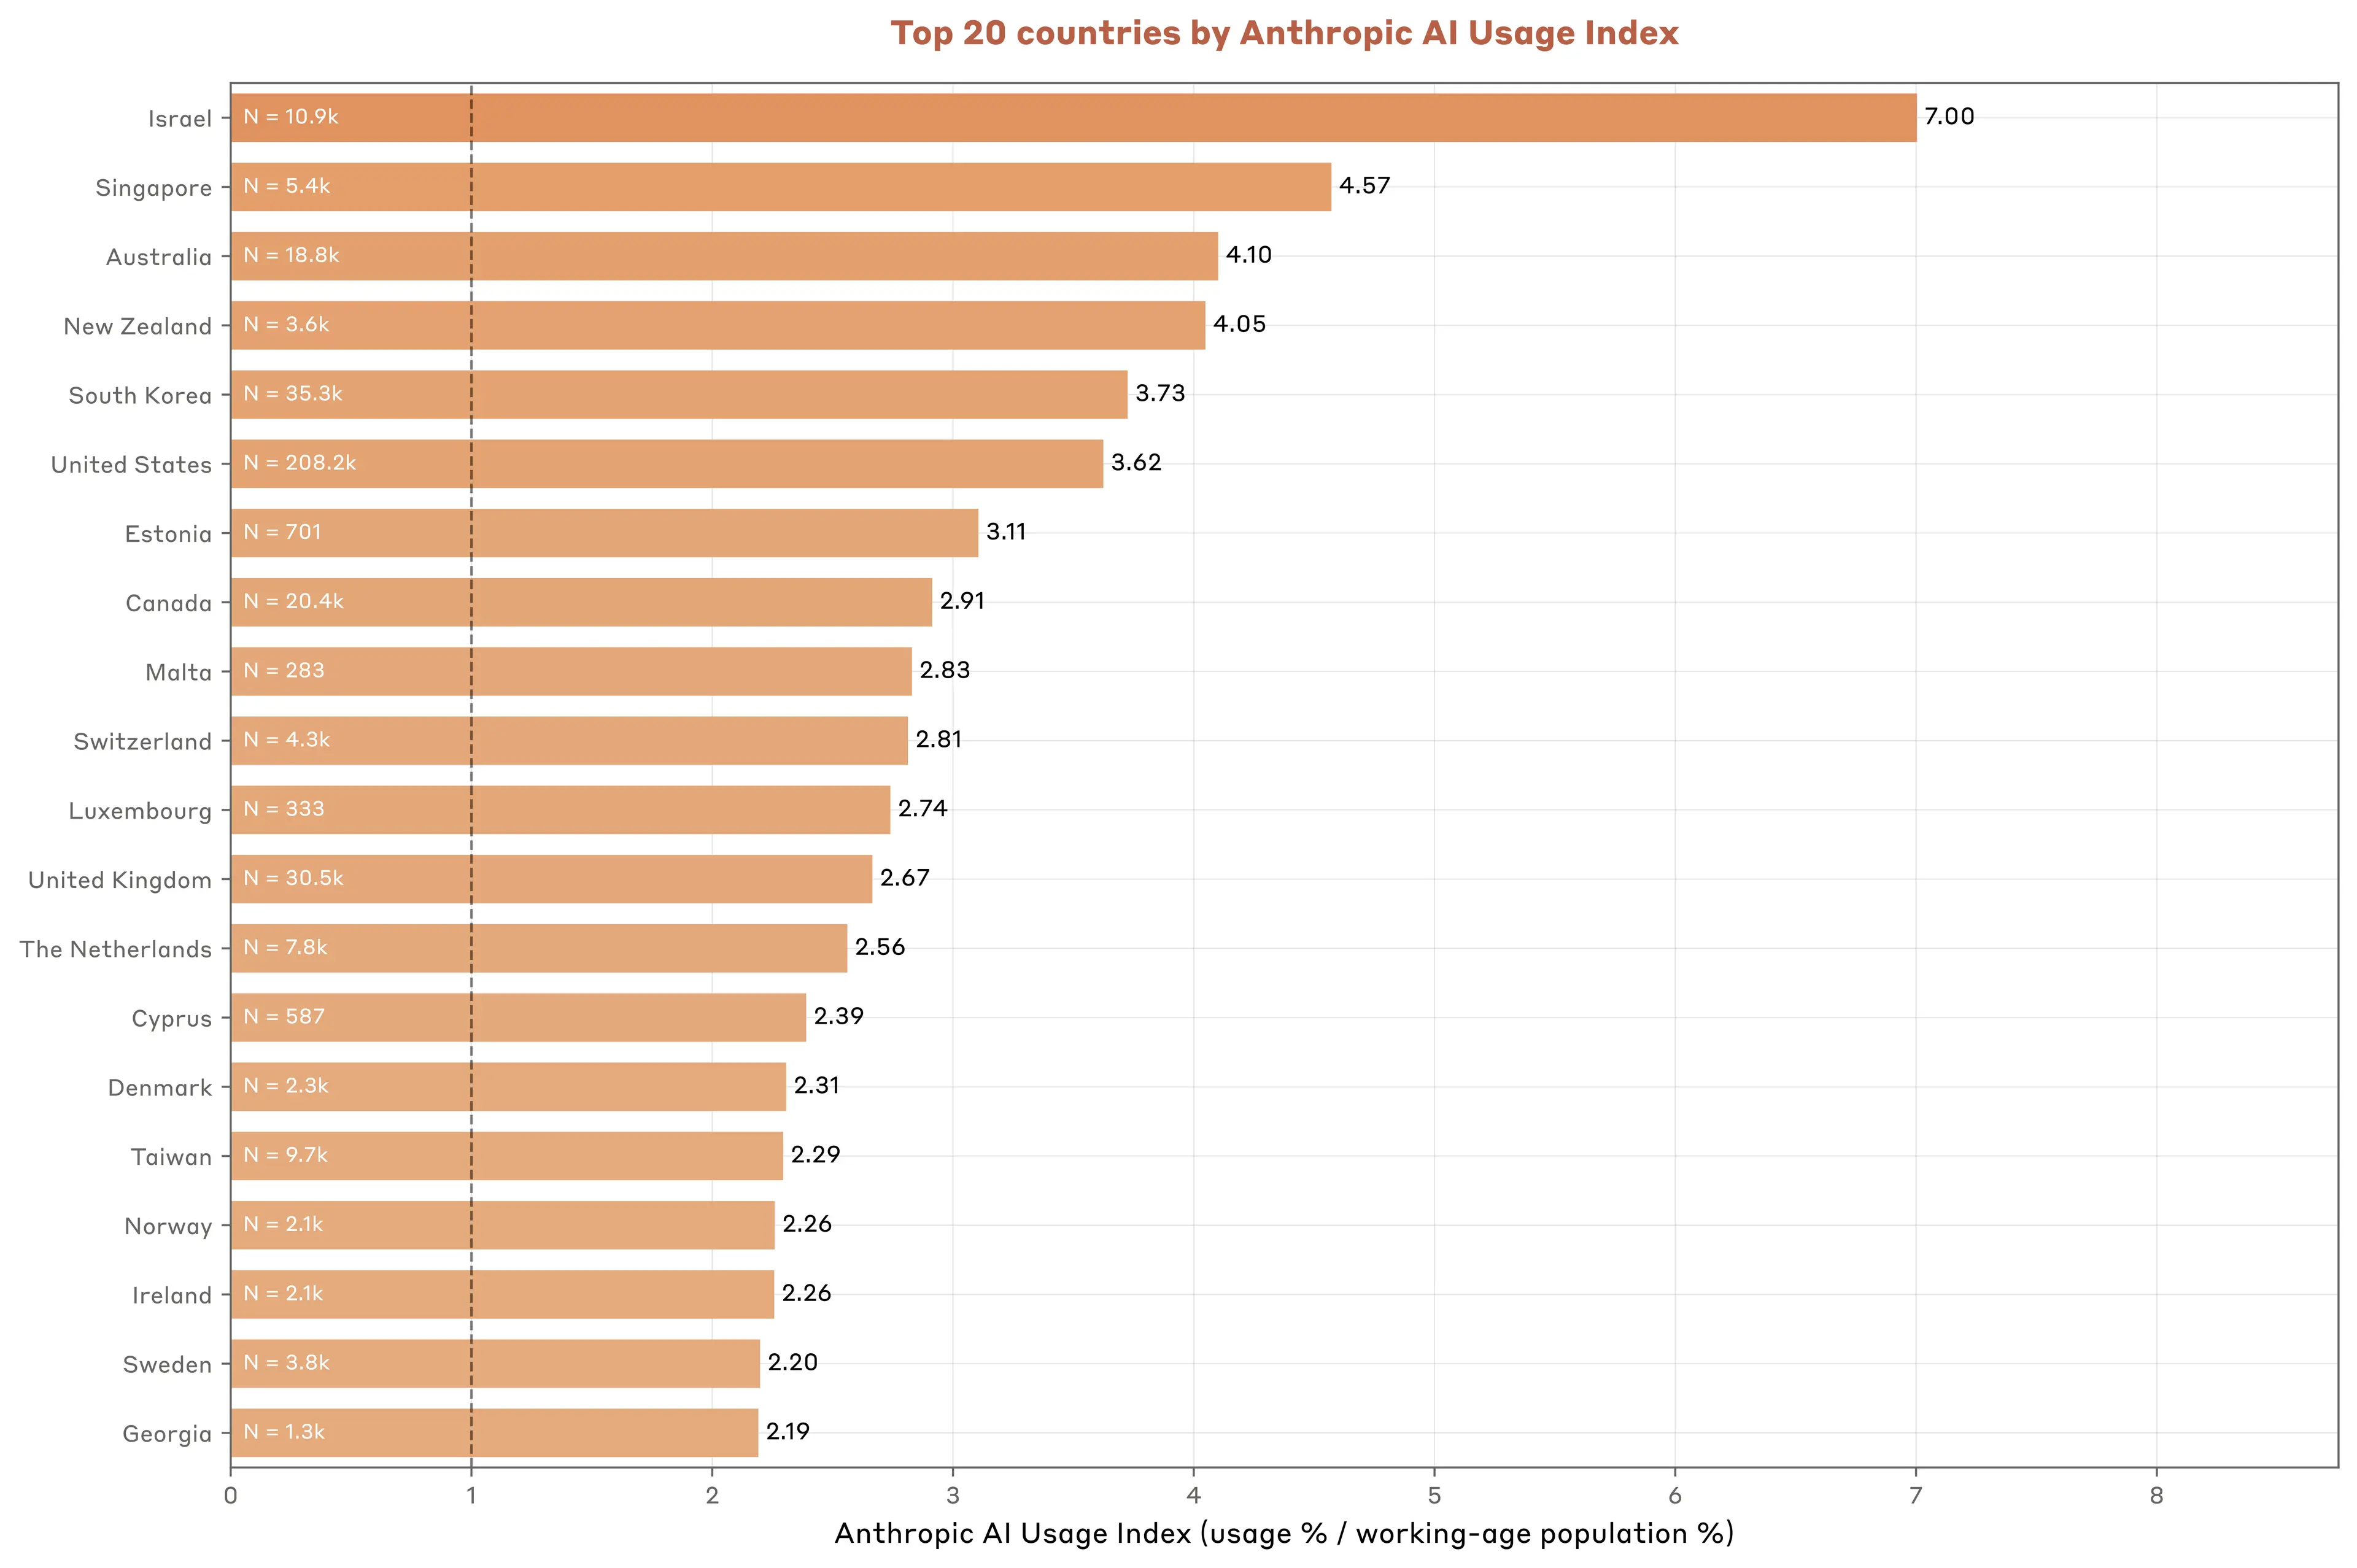
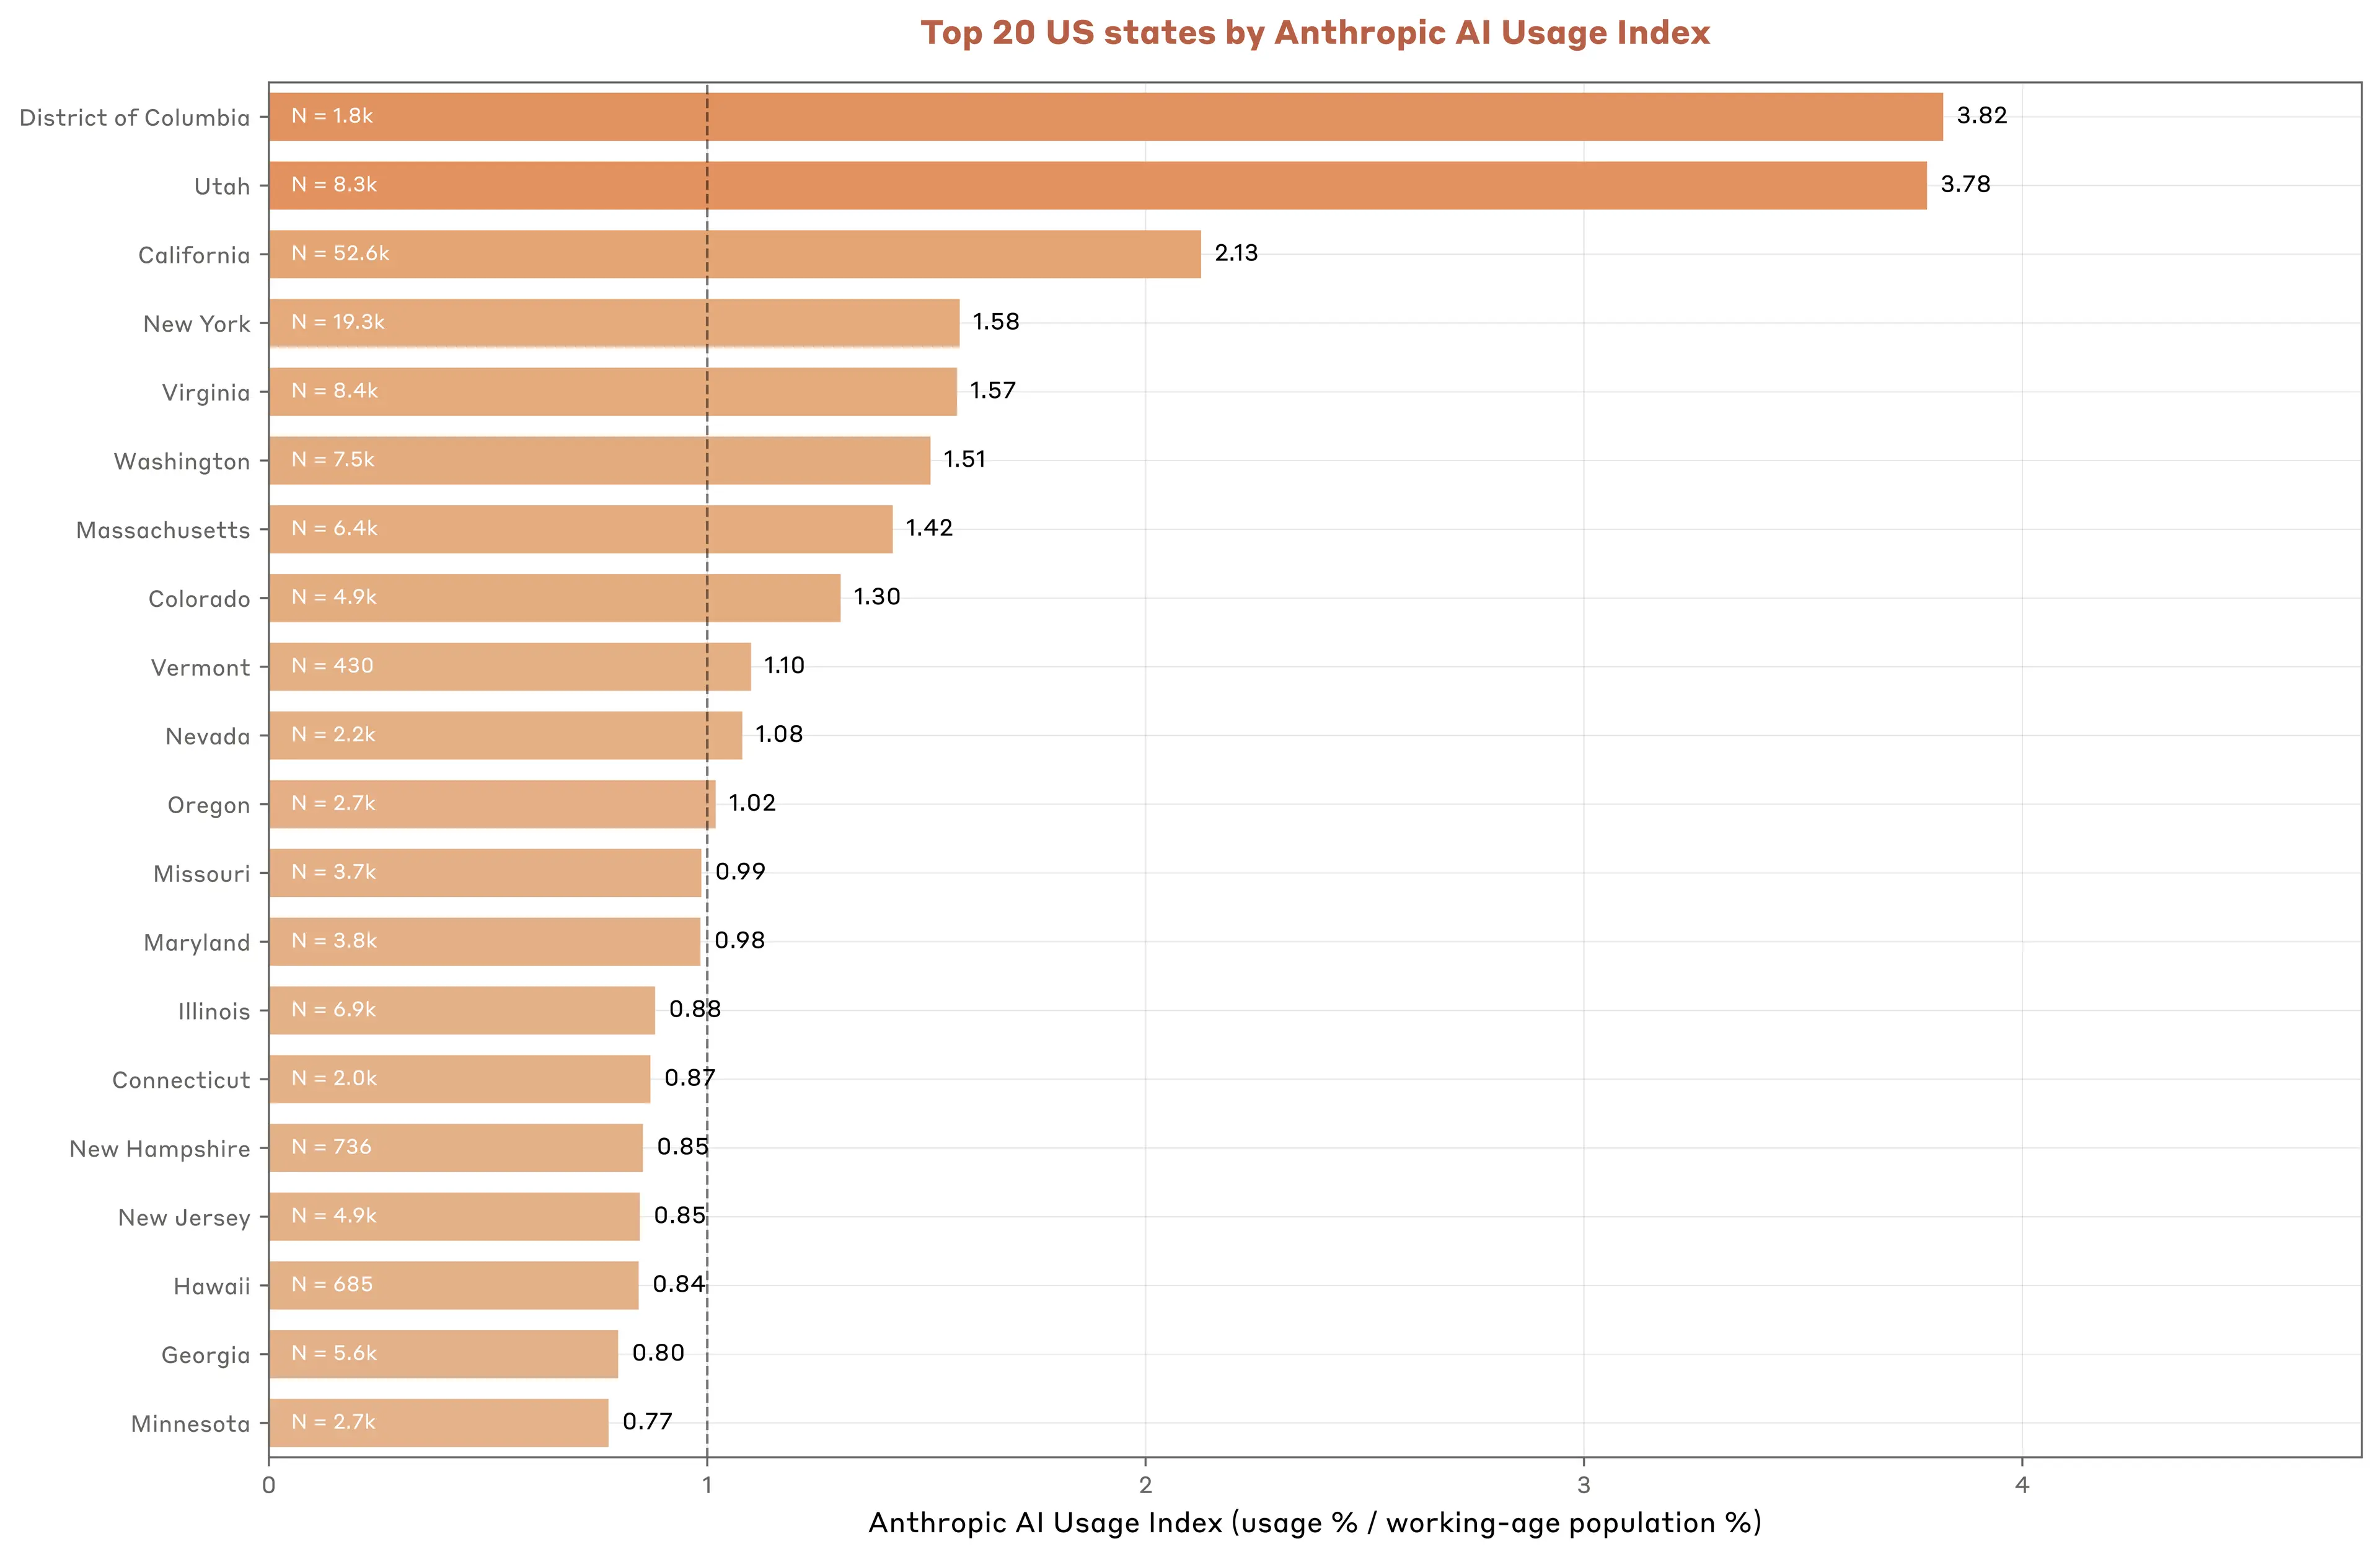
Anthropic Economic Index #
Anthropic Economic Index report

